Is climate change occurring in IL? Do we care?
by Peter Schwartzman
Fortunately for us, for more than fifty years, diligent employees and volunteers have been painstakingly measuring meteorological variables in cities and towns across our country. This information, once collected and analyzed, provides us a means to determine what, if any, changes are occurring. While the past is not a definitive predictor of the future, much can still be learned by examining a location’s (or region’s) climatological trends and comparing them to predictions made by complex, computer-intensive climate models. Such a comparison helps to establish what has occurred and what the future may hold for a location. Both considerations are of great importance for economic, agricultural, and energy-related reasons.
Countries and communities the world over are reflecting on projected climate changes and are responding in novel and discernable ways. Just last month, the Kyoto Protocol became the world’s first active climate change treaty. Its entry into force, which required passage by a sufficient number of countries (who combined had to represent more than 55% of the world’s industrialized emissions), now requires developed nations to cut emissions of greenhouse gases by 5.2% below 1990 levels by 2008-2012. Many of the more than 140 nations that have signed and ratified the Kyoto Protocol have already begun reducing their emissions significantly in a variety of ways, including transitioning to renewable energy forms (e.g., wind, geothermal and solar). While the United States and Australia are two of a limited number of holdouts to the Protocol, many U.S. states and cities are adopting their own protocol-like commitments. With all of these discussions and policies under way, it is important for us to look at our region and determine where we stand on this issue as well. One of the first places to start is with the data.
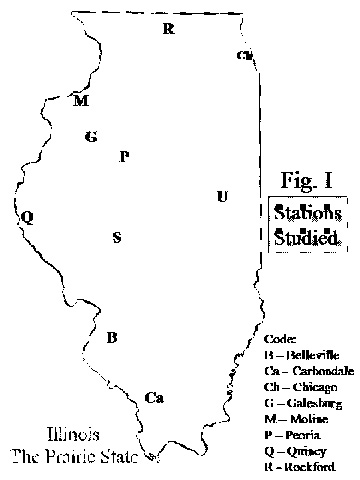
 So, are we experiencing climate change in Illinois? To figure this out, I decided to examine climatological records for ten cities throughout the state (shown in Figure I). The data that I analyzed, which can be obtained at the IL State Climatology Office (www.sws.uiuc.edu/atmos/statecli/), consisted of monthly precipitation and temperature measurements taken since 1950. This data was further broken into seasonal chunks, since, climatologically speaking, seasons are a more revealing unit of analysis than months. Five temperature variables were analyzedñhigh daily, low daily, mean daily, # of days where 90 degrees Fahrenheit was eclipsed, and # of days where sub-32 degree temperatures were observed. Two precipitation measures were analyzedñmonthly precipitation totals and monthly snowfall totals. Once the data was properly categorized (by variable, season and year), it was analyzed using linear regression analysis (LRA). LRA is a common method to discern changes in climatological variables, such as temperature. So, in total, more than 240 individual analyses where conducted.
Before exploring the results, a brief introduction to statistics is necessary for some, especially since so little attention is paid to explaining statistical results in the mainstream media, despite their ubiquitous reference and rhetorical power. A finding is said to be significant if is unlikely to have occurred by chance, where "unlikely" means "less than 5% chance." For the purposes of the following discussion, I will use the term "significant" in this specific way and the word "tendency" to refer to a changes that are directional but do not meet the statistical rigor to be considered significant. And while "significant" results often represent outcomes that require our attention, actually, the importance of a result lies in the rate of change observed (i.e., the slope of the "best-fit" line that fits the data). Thus, it is important to consider the rate of change as well as the statistical significance of any result.
Lastly, there are two ways to look at results, individually or collectively. Looking at them individually means determining if one line (drawn though the data for one variable, location and season) is significant (or important). For instance, an individual analysis answers the following question, "Is it snowing more in Galesburg in the winter?" Looking at results collectively requires seeing if individual results are behaving in a similar way to one another. For instance, a collective analysis allows us to answer regional questions such as, "Is it snowing more in IL during the winter?" It is through the combination of individual and collective analyses across temporal (time) and spatial scales that one can discern if climate change is occurring.
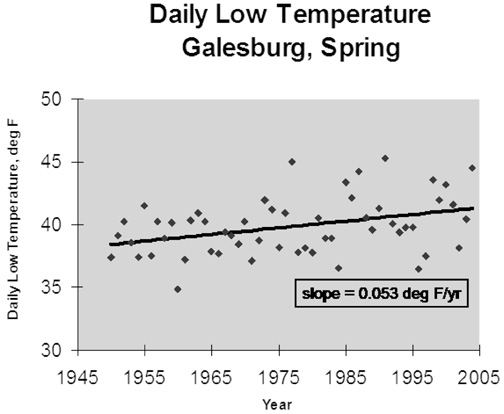
Okay, back to the results of my ten station study. First, let’s look at temperature. High daily temperatures (HDTs) are not changing in a uniform direction; as many cooling tendencies are observed as warming ones. (Locally, Galesburg’s HDT is significantly cooling in summer and fall; by about 2 degrees since 1950.) Interestingly, while HDTs are going up rapidly in Belleville, they are declining precipitously in Carbondale, which given the close proximity of these two locations suggests something local (rather than regional) is causing these changes. However, the number of days which go above 90ºF is declining in 28 out of 30 analyses (a significant result); yet, very few of these changes are significant on an individual basis. Notably, low daily temperatures (LDTs) are increasing across the board with five stations (including, locally, Galesburg, Peoria, and Quincy) exhibiting significant increases in spring (and two locations expressing significant changes in summer as well). And, not surprisingly, the number of days in which it cooled below 32 degrees is decreasing in nearly all seasons and all locations. More impressively, eight of the ten locations exhibit significant declines in sub-32 degree days in spring and three exhibit significant declines in winter as well. The mean daily temperatures (MDTs) observed mimic the changes found in the LDTs and so are generally increasing in most places and seasons, with significant increases in spring. The significant changes in low (& mean) temperature records are important for two reasons. One, in terms of the magnitude of the change, consider what is happening in Galesburg during spring. It is observing 9 fewer days in spring where the temperatures dips below freezing today than it did in the early 1950s. This obviously allows for longer growing seasons, which seems like a good thing. But, shifts in biological clocks of this magnitude in such a short period of time can cause many problems including the inability for migrating birds to find food in a timely fashion and the ability for agricultural pests to reproduce and disperse more readily. Two, most climate models suggest that increases in low daily temperatures is one of the key responses to be expected. Galesburg’s increase in LDTs during spring (shown in figure II) and summer are also sizeable, +2.9ºF and +1.5ºF, respectively, since 1950. Changes of this order of magnitude suggest that global climate change may indeed be taking place in our neck of the woods and, as such, are definitely worth keeping an eye on.
�Now, for the precipitation changes. There are a significant number of stations/season analyses indicating wetter conditions with nearly all stations showing more precipitation in all seasons but summer. But since so few (only two) of individual station/season analysis are themselves significant, it appears that the wetting that is taking place isn’t substantial. Snowfall is declining throughout the state, though, once again, the reductions observed aren’t individually significant. One notable exception to this however, is snowfall in Galesburg during the spring (March-May) which is down significantly. Two heavy spring snows early in the period of record make this result artificially significant.
So, what do we make of these results. The Environmental Protection Agency has a website specifically dedicated to climate change and Illinois and includes a electronic copy of the EPA’s 1997 report entitled, "Climate Change and Illinois,": (yosemite.epa.gov/oar/globalwarming.nsf/content/us-Illinois.html). In this 4-page report (that I recommend everyone read), it briefly outlines the global and regional climate changes that have occurred or are anticipated to occur. The results obtained in my study are largely consistent with the report’s information. For instance, the report asserts that snow cover has been declining in the Northern Hemisphere and global mean temperatures have warmed in the past century. The increases in IL precipitation that I found are anticipated by climate models since they predict "that the rate of evaporation will increase as climate warms, which will increase average global precipitation" (EPA). The lack of increase in high daily temperatures is the lone notable exception to changes expected in climate globally as atmospheric greenhouse gas concentrations continue to rise this century.
All of the above being said, it would be wrong to expect a region the size of IL to mimic global temperature and precipitation changes exactly. Thus, the changes we observe are indicative of what one might expect given our current understanding of past and future climate change. Most global warming scenarios suggest that there will be regions that will not exhibit the same climate change signature as the planet as a whole. When we add to this the inherent uncertainty in climate projections, one can easily become confused by or even dismissive of these results. Unfortunately, given the importance of the changes that are likely, we cannot afford to be too skeptical or disinterested.
If we need any indication that climate change might be important, just consider what the leaders in England have been saying about. Tony Blair’s chief scientific adviser, Sir David King, has described global warming as "a greater threat than terrorism," while Blair himself has also openly referred to it as "the greatest threat currently facing civilization." Perhaps, this apparent hysteria is due to the fact that heatwaves in Europe claimed more than 20,000 people in 2003. Maybe it comes on the heels of reports out of the Arctic that unprecedented warming has been observed there. Or perhaps, it has to do with the fact that scientific evidence currently has greater standing outside of the U.S. (rather than inside); this comment stems, in part, from the perplexing removal of any mention of climate change in a recent national air quality report released by the USEPA during the last Bush Administration (more on this at: webexhibits.org/bush/5.html). Whatever the reason, we all better attempt to find out if the hype is justified. If it is, and Illinois’ climate changes over the past 50 years do not give us reason to think otherwise, perhaps more of our time needs to be spent (in homes, schools, media, congressional hearings, etc.) grappling with this mighty issue.
For more reading on the subject of climate change, I strongly recommend the following:
(1) Changnon, S. A. et al. (1997) An investigation of historical temperature and precipitation data at climate benchmark stations in Illinois. Illinois State Water Survey Circular 184, Champaign, Illinois, 77 pp.
(2) Gelbspan, Ross. (2004) Boiling Point. Basic Books, 254 pp.
(3) Grossman, Daniel. (2003) "Spring Forward." Scientific American, December, 85-91.
(4) Houghton, John. (2004) Global Warming: The Complete Briefing. Cambridge University Press, 382 pp.
(5) Lynas, Mark. (2004) High Tide. Picador, 345 pp.
Peter Schwartzman is associate professor and chair of the Environmental Studies Program at Knox College. He is a research climatologist with peer-reviewed publications in the area of climate change and human population growth. He is currently writing two books which will attempt to communicate environmental understanding to a broad audience.